If you'd rather speak to someone now, call
+91 7219084311.
You can also email us at hello@valardigital.com
+91 7219084311.
You can also email us at hello@valardigital.com
Conversion rates in GA4 (Google Analytics 4) were the most anticipated feature every marketer was waiting for after playing the most crucial role in Universal Analytics.
Although we could still see the total number of conversion rates in GA4, users need more matrices to get in-depth reports because they only use the percentage of sessions that perform well.
On the bright side, conversion rates are now fully available on Google Analytics 4, and we’ve created an essential guide to use them.
Note: It’s essential to consider a few changes made in GA4 since Google has been updating the platform rapidly.
Conversion is a milestone for visitors when they complete a specific action on the site or app.
For instance, the end goal for most businesses is to serve their customers and create profits in return. In this case, a conversion would be when a customer purchases a product on their site. That means the customer is converted by clicking the product ad and completing the intended process of purchase.
The more the customers complete the same process, the more sales are generated, therefore, customer conversion.
Now, businesses can judge their success by measuring the number of conversions made on their website.
Here are a few examples of conversions in businesses:
Now that we know what conversions are, conversion rates are pointers of all customers combined.
Conversion rates in universal analytics were calculated through sessions with conversions divided by all sessions.
Doing this will get you a number of sessions in total converted.
Although, in Google Analytics 4, you can see a few exciting upgrades to conversions!
As of 2023, there are two types of conversion rates in Google Analytics 4:
Let’s explore them in brief:
The session conversion rate is calculated by dividing the number of sessions, including a conversion event, by the total number of users on the platform.

For instance, here’s a simplified example:
Suppose a User-1 has landed on your website organically through Google search, but the same user lands on your website through an email newsletter this time.
Since user-1 came to our site organically, the next time he uses our website portal, i.e., an email newsletter. This means that user-1 has completed a milestone and is converted.
In this case, we have two sessions in total, and one of them had a successful conversion.
User-1 is a prime example of 50% session conversion.

Now we have a User-2 who has landed on our site through paid Google ads campaign and is converted. User-2 gets converted again from the next session and sets a milestone of a total of two session conversions.
User-2 is a prime example of 100% session conversion (Since we had a conversion from both sessions).
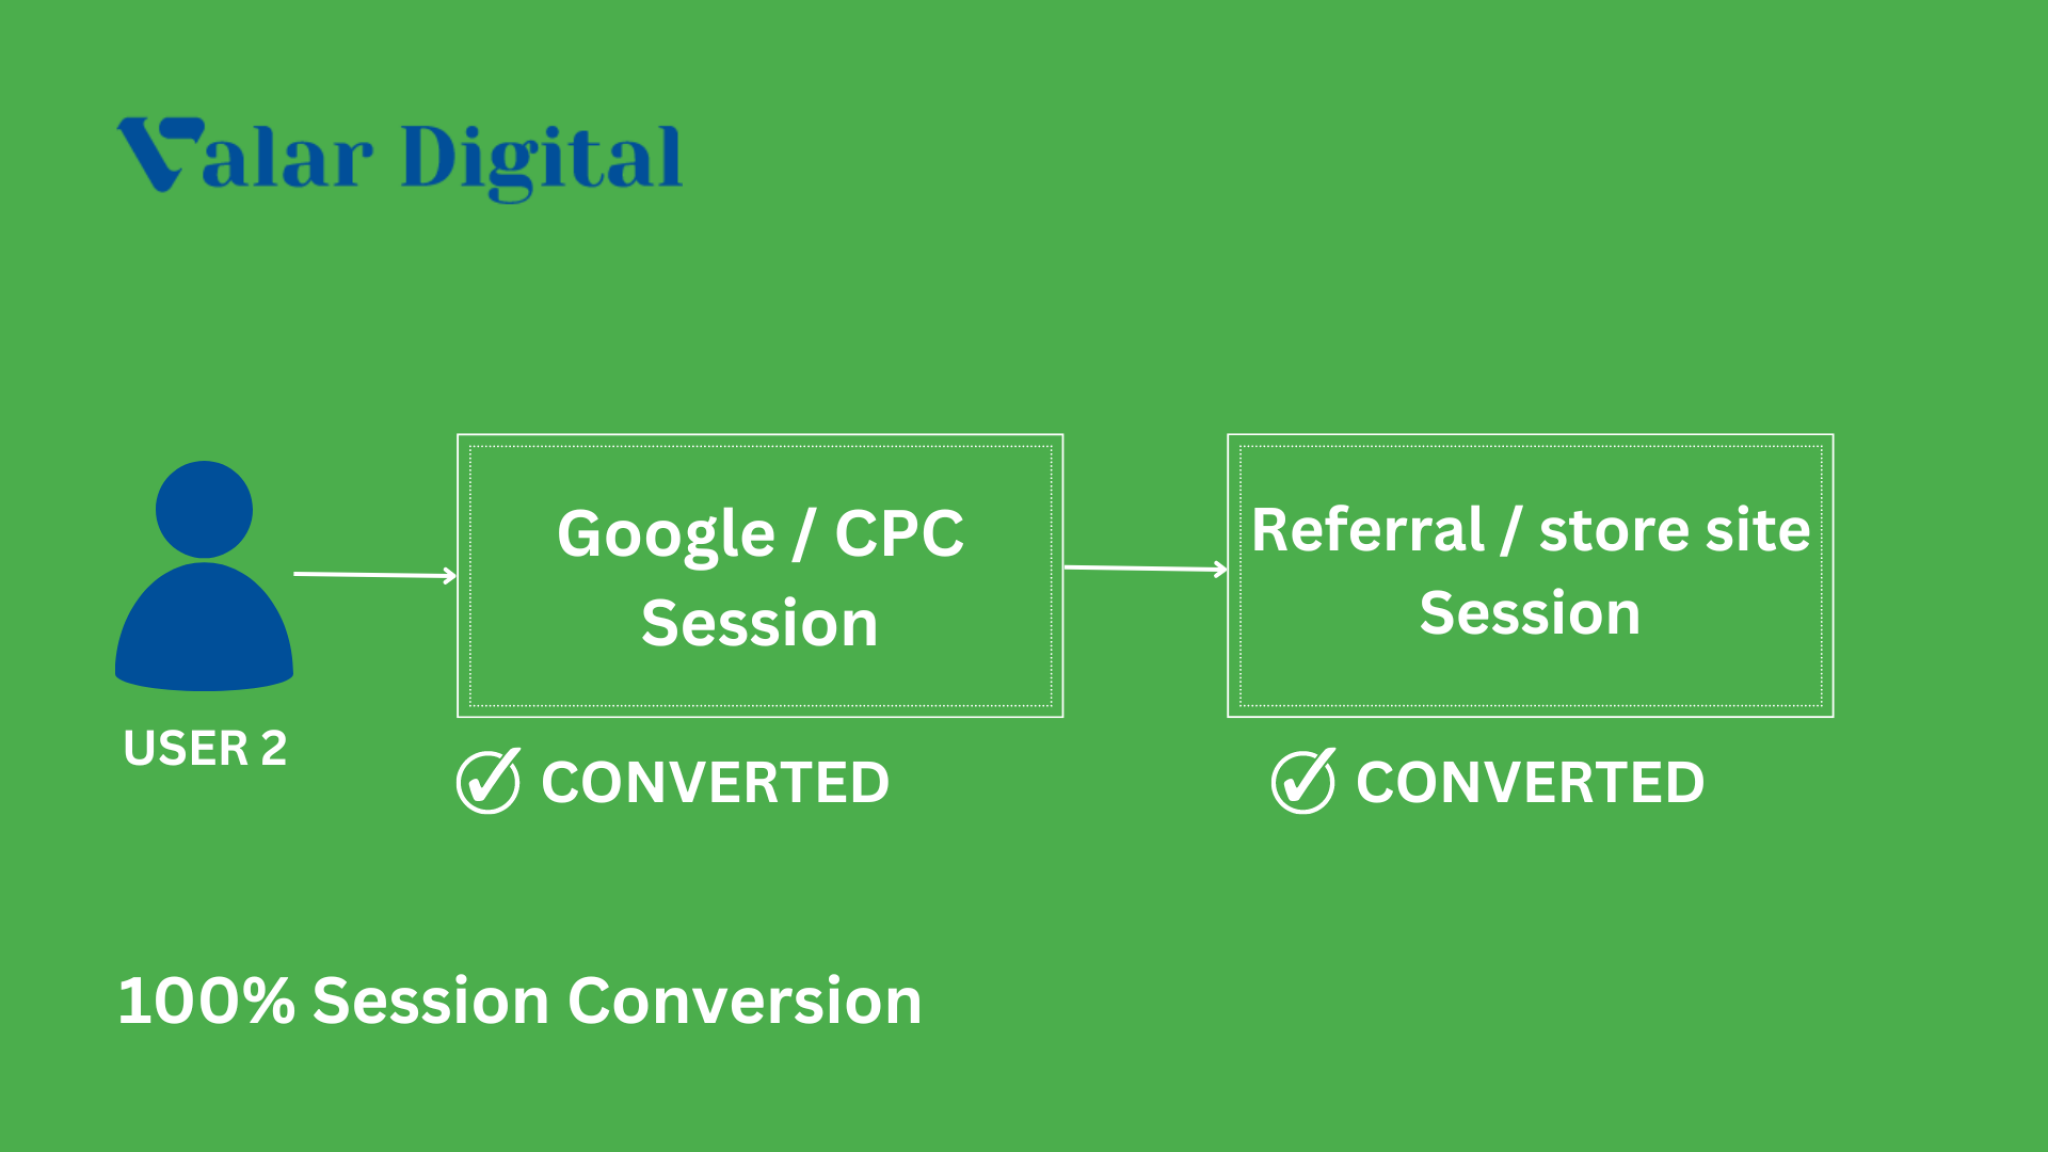
Since we have a total number of 4 sessions where three consecutive conversions are made, the number of conversions (3) divided by the total number of sessions (4) multiplied by 100% that is:
3 / 4 x 100% = 75% session conversion rate (CR).
Great! You’ve made it!
Well, if you want to convert a user once in all the created sessions, Google Analytics 4 has the user conversion rate, for that matter.
The user conversion rate is all about converting users in particular sessions. When the user is converted, the pointer sets to 1.
Since the user conversion rate is accounted for only when the user is converted once through the platform, the rate stays constant since the user conversion is recorded only once in the past.
To calculate the user conversion rate, you need to divide the number of users who’ve triggered the conversion event by the total number of users on your platform.

Note: Once you’ve market events as conversions in GA4, the session conversion metrics are populated automatically in the reports. Setting up a conversion tracking event in GA4 is another way to load the metrics automatically.
✓ Ensure you’ve set up conversion tracking in GA4 property or have marked events as conversions in GA4.
✓ Ensure the conversion events are successfully recorded and tracked by GA4 in reports.
Head over to Google Analytics 4 property and select the Explore tab on the left side of the screen.

Select the Blank report template in the Explore panel. Doing this will allow you to create new explorations reports for your business.

A form creation panel will appear where you must start by inserting an appropriate exploration name. Here we’ve named our exploration form ‘Conversion rates of goals.’
Now it’s time to set the date of the report – From when till when do you want the data to be seen in the reports?
Insert the preferred dates in the dates section: for instance, we’ve set a 1-month time scale for the report.
Now click the plus (+) button next to DIMENSIONS.
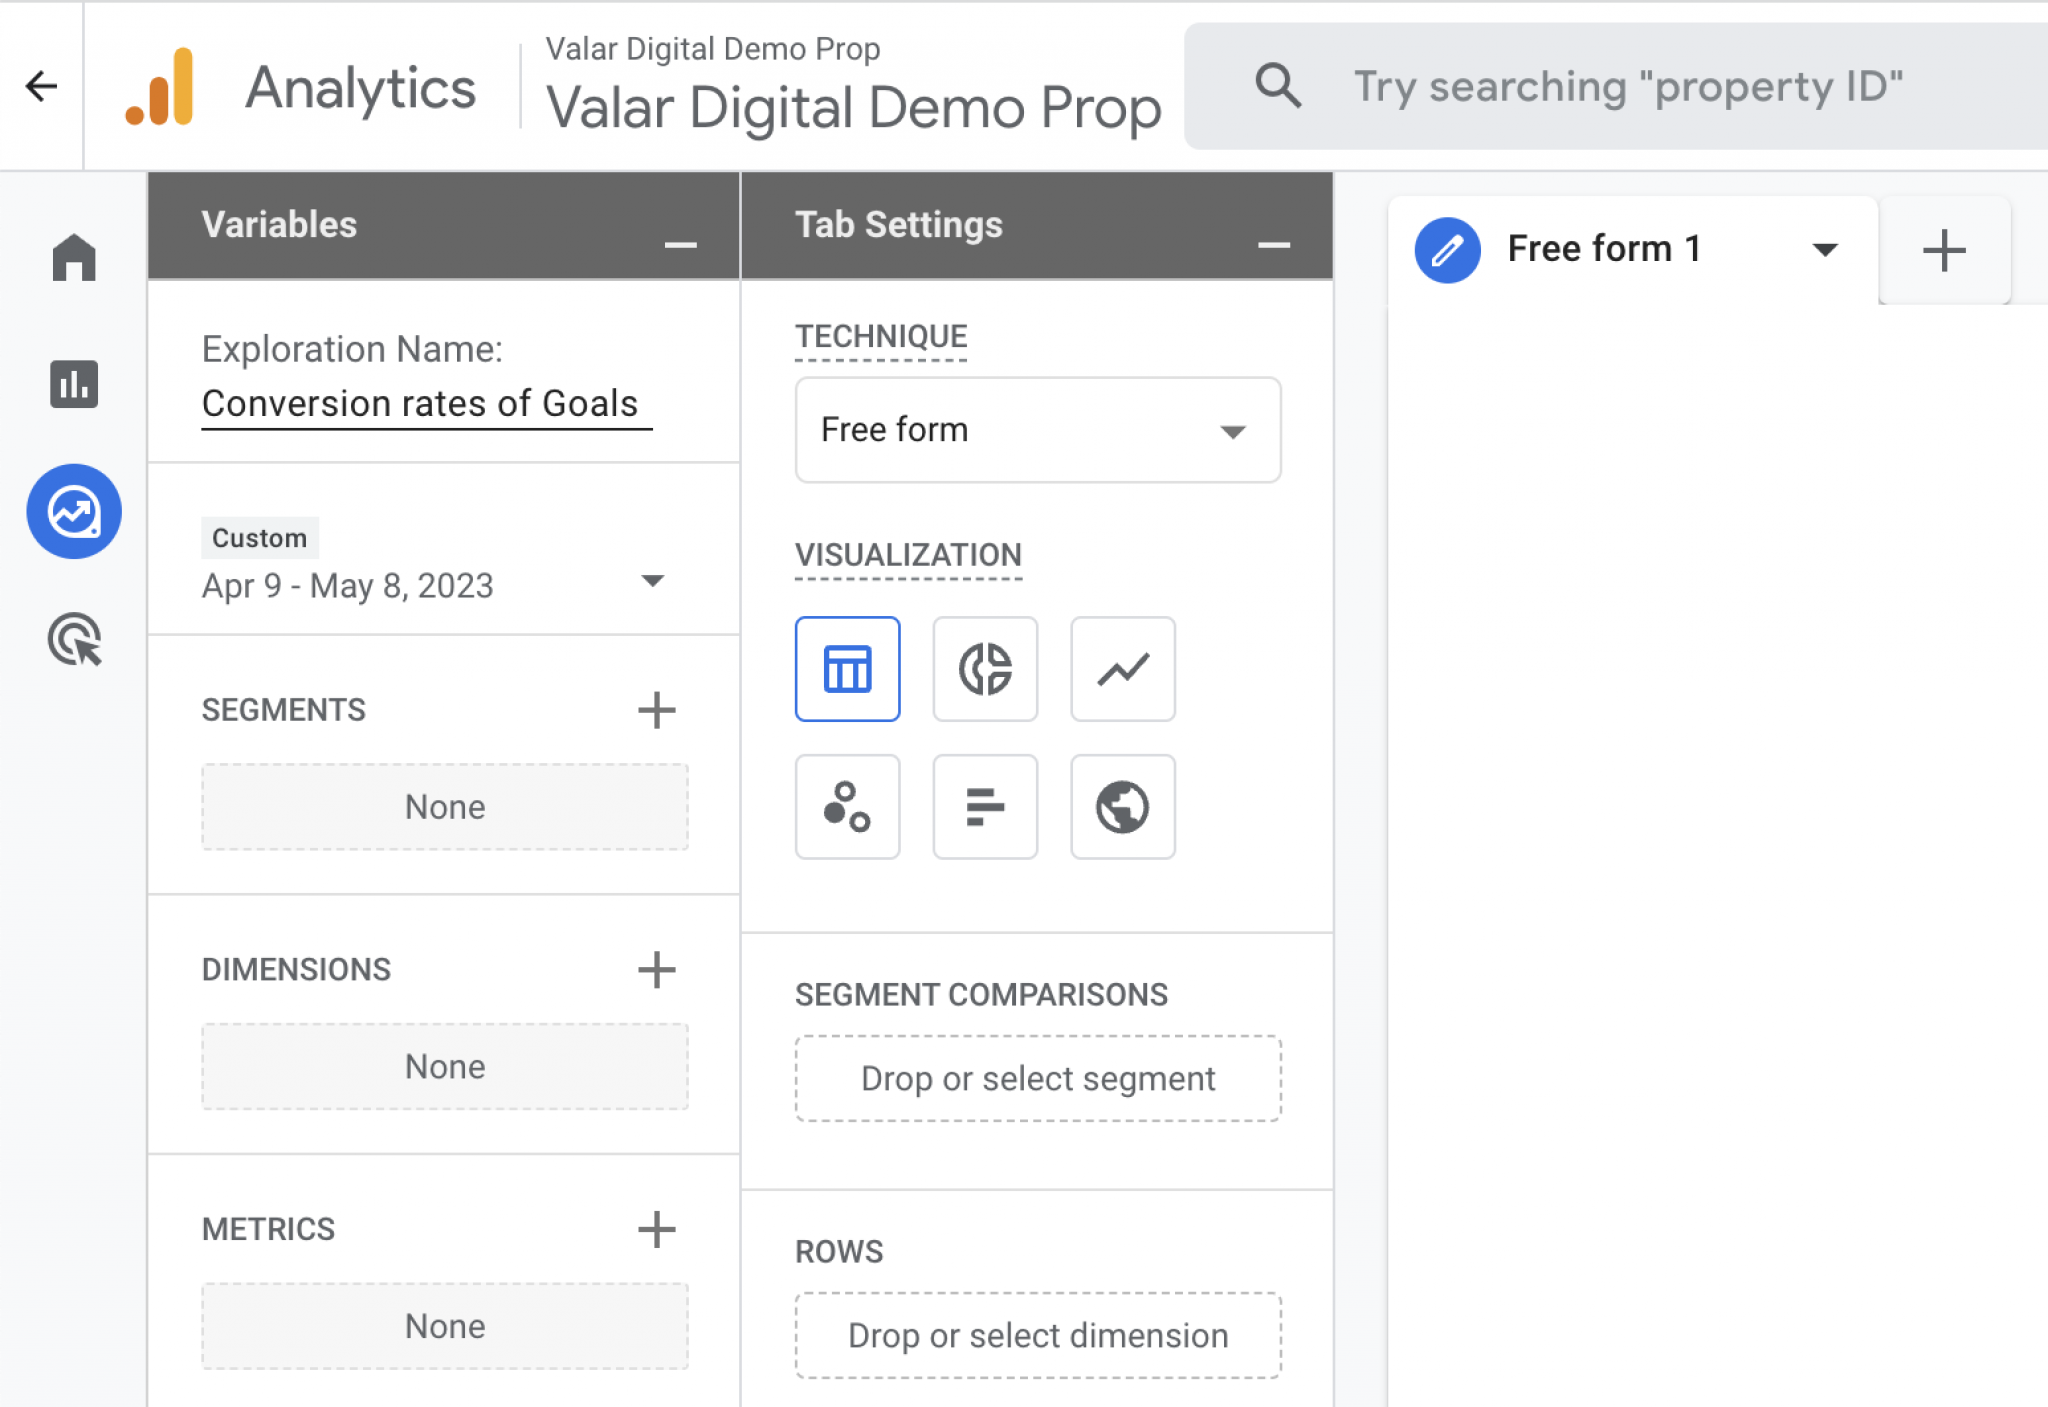
In the dimensions section, type ‘event name‘ in the search box beside the import button.
Check mark (✓) the Event name tag from the search results and click Import.

Now double-click the event name block in the selected dimensions to add it to the rows section manually.
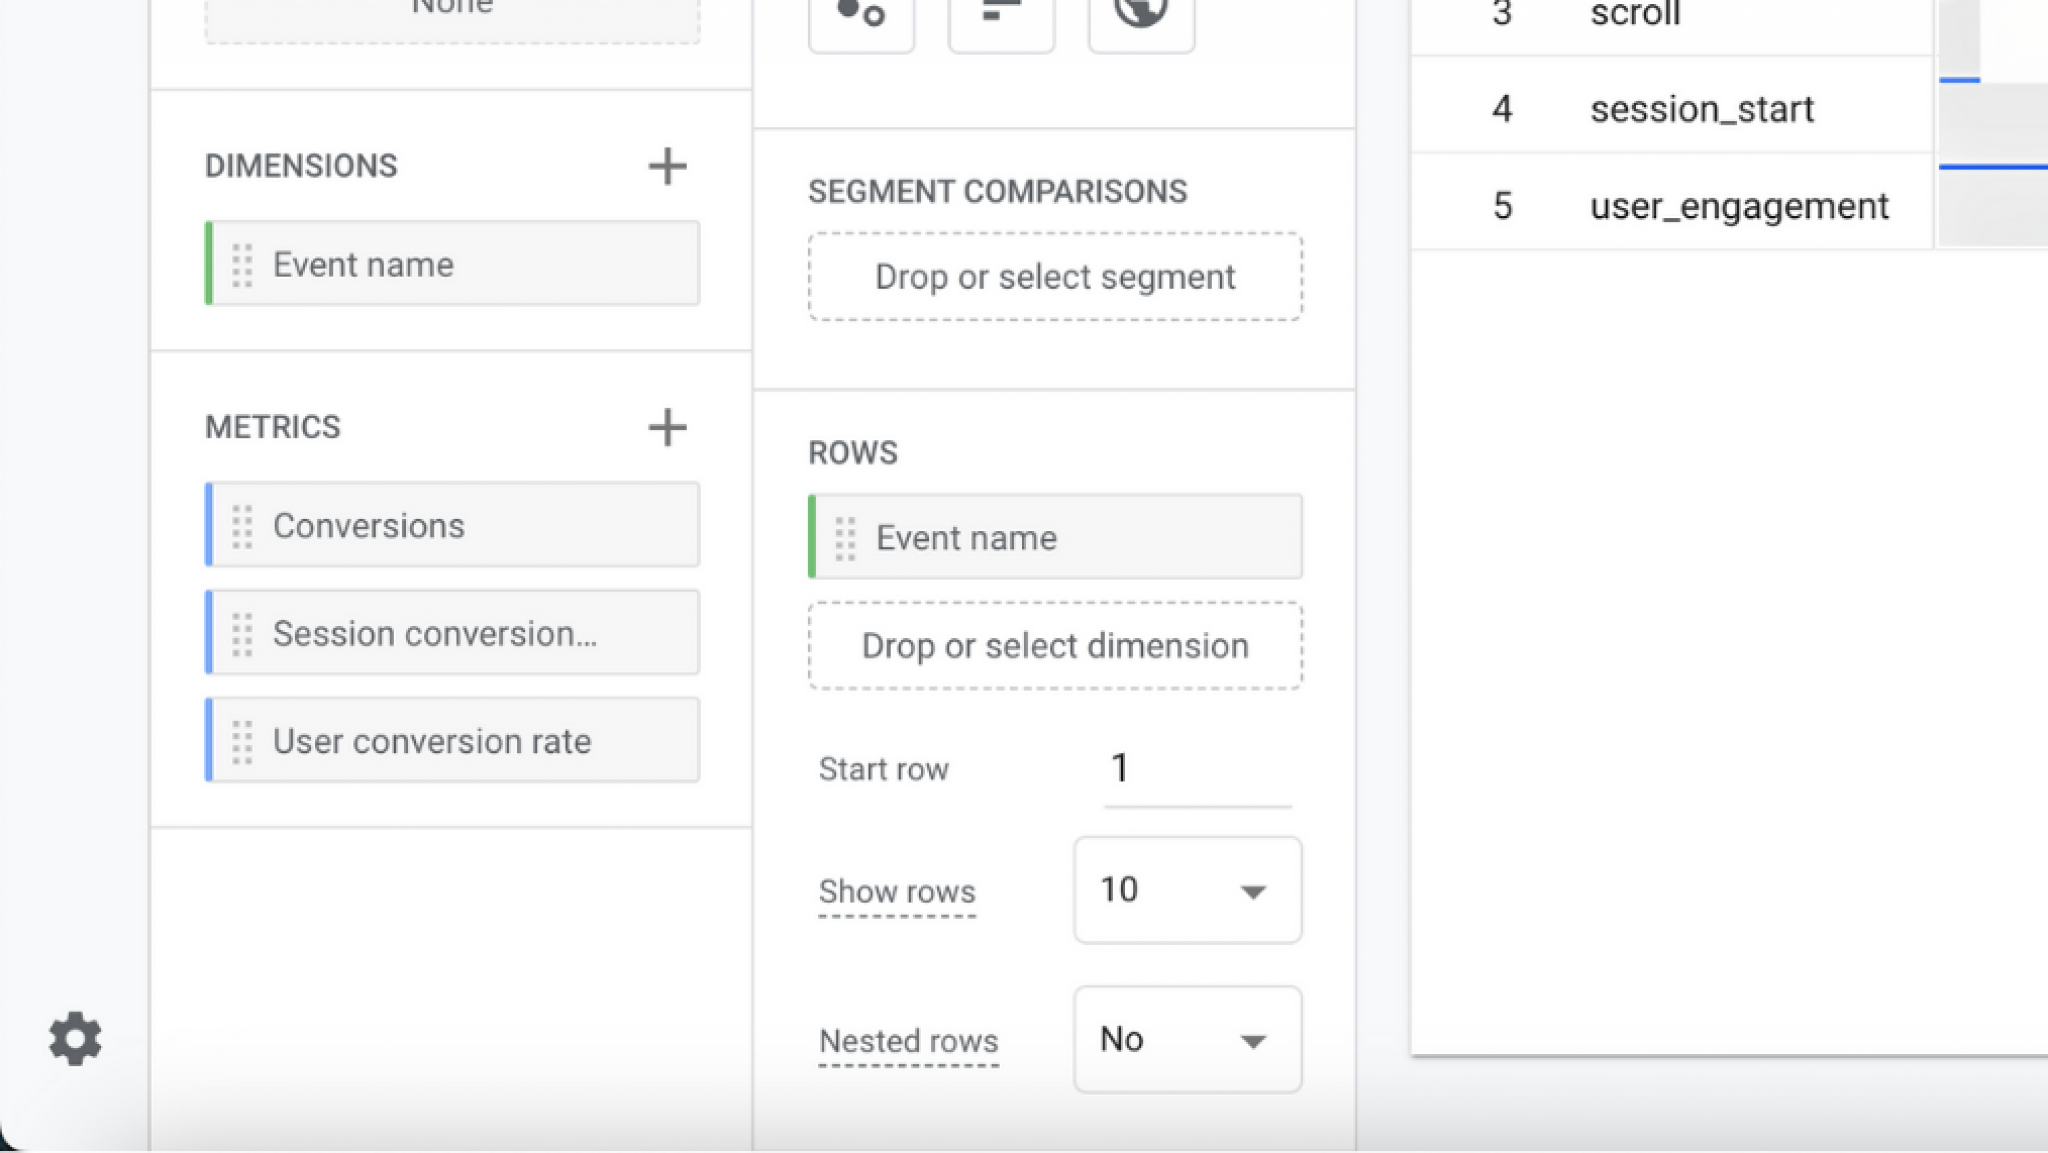
Remember: You will not encounter any changes on the form after double-clicking the ‘event name’ in the dimensions, probably because you haven’t added any metrics in the canvas.
Here’s how you can add metrics in the canvas to reflect the dimensions in the reports.
Click the plus (+) icon beside the METRICS section.
When the metrics section is revealed, type ‘conversion’ in the search box near the import button and select below:
✓ Conversions
✓ Session Conversion Rate
✓ User Conversion Rate
And Click Import.
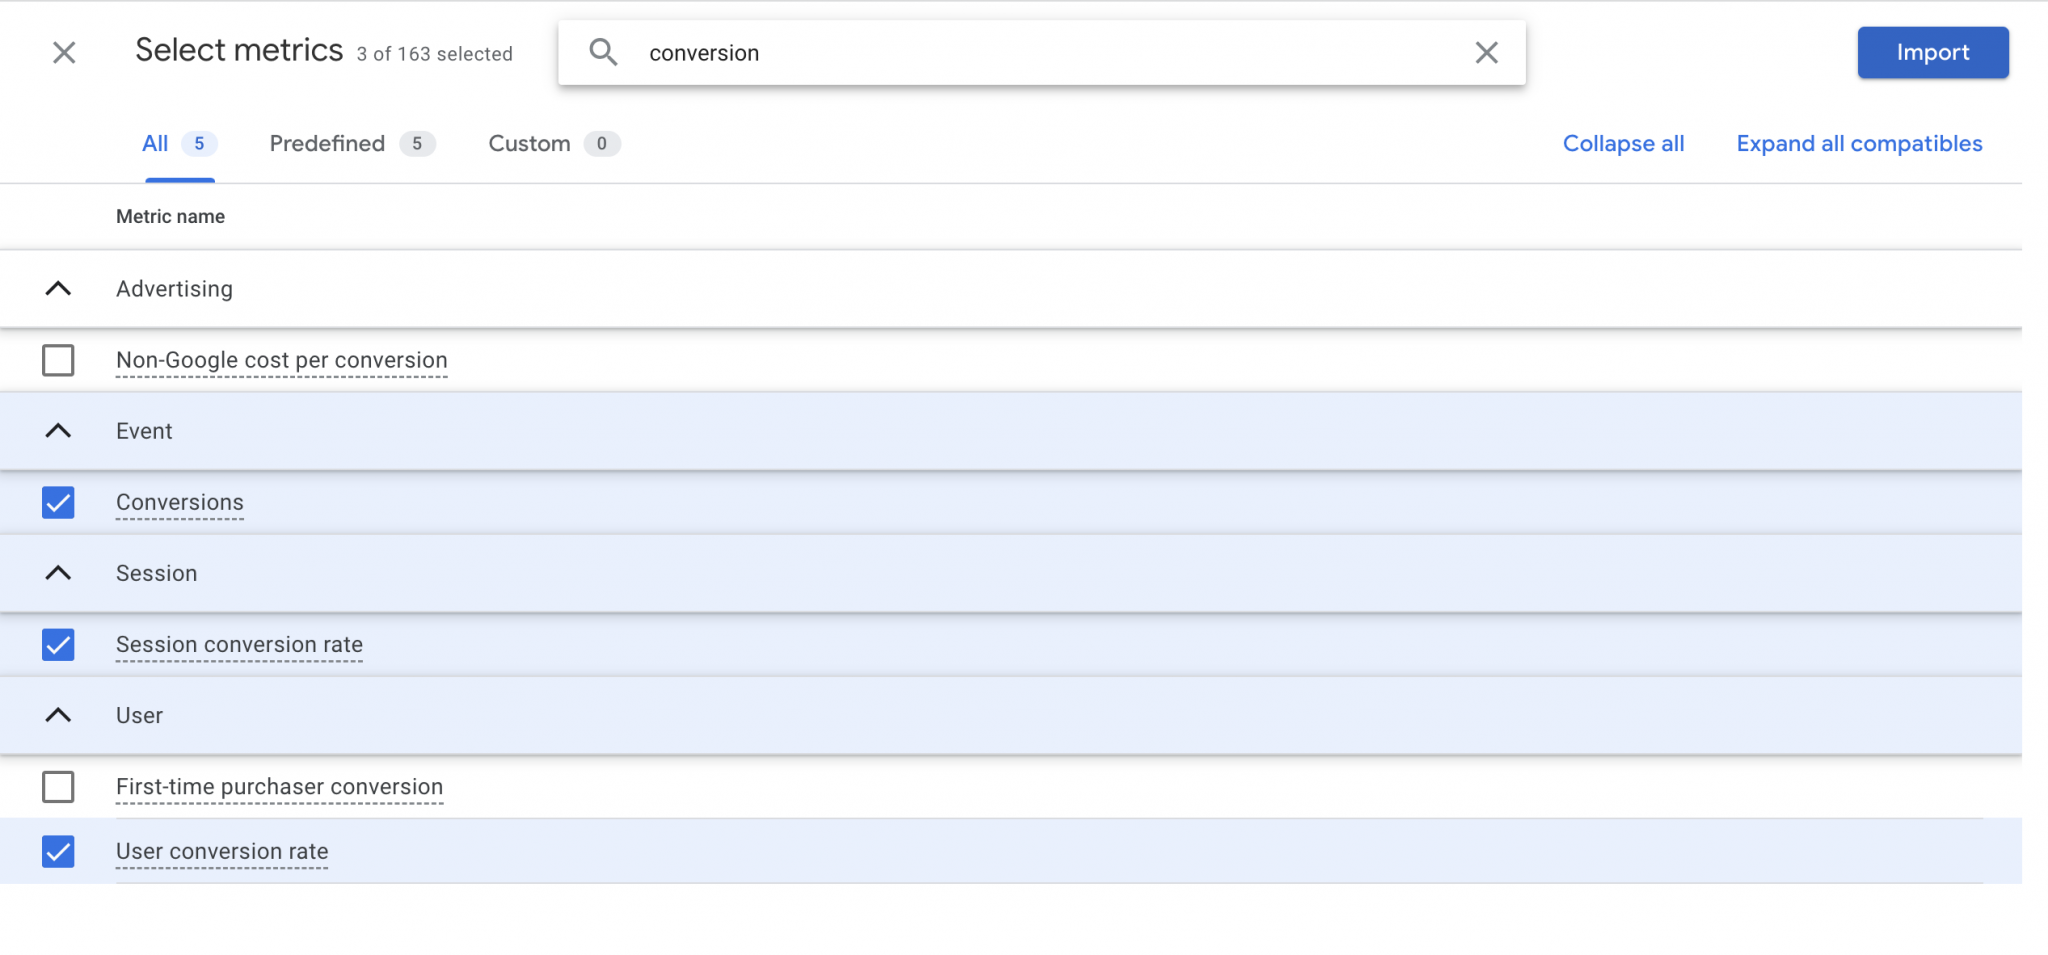
After importing the metrics to the reports, you can double-click them individually to reflect automatically to the free form-1.
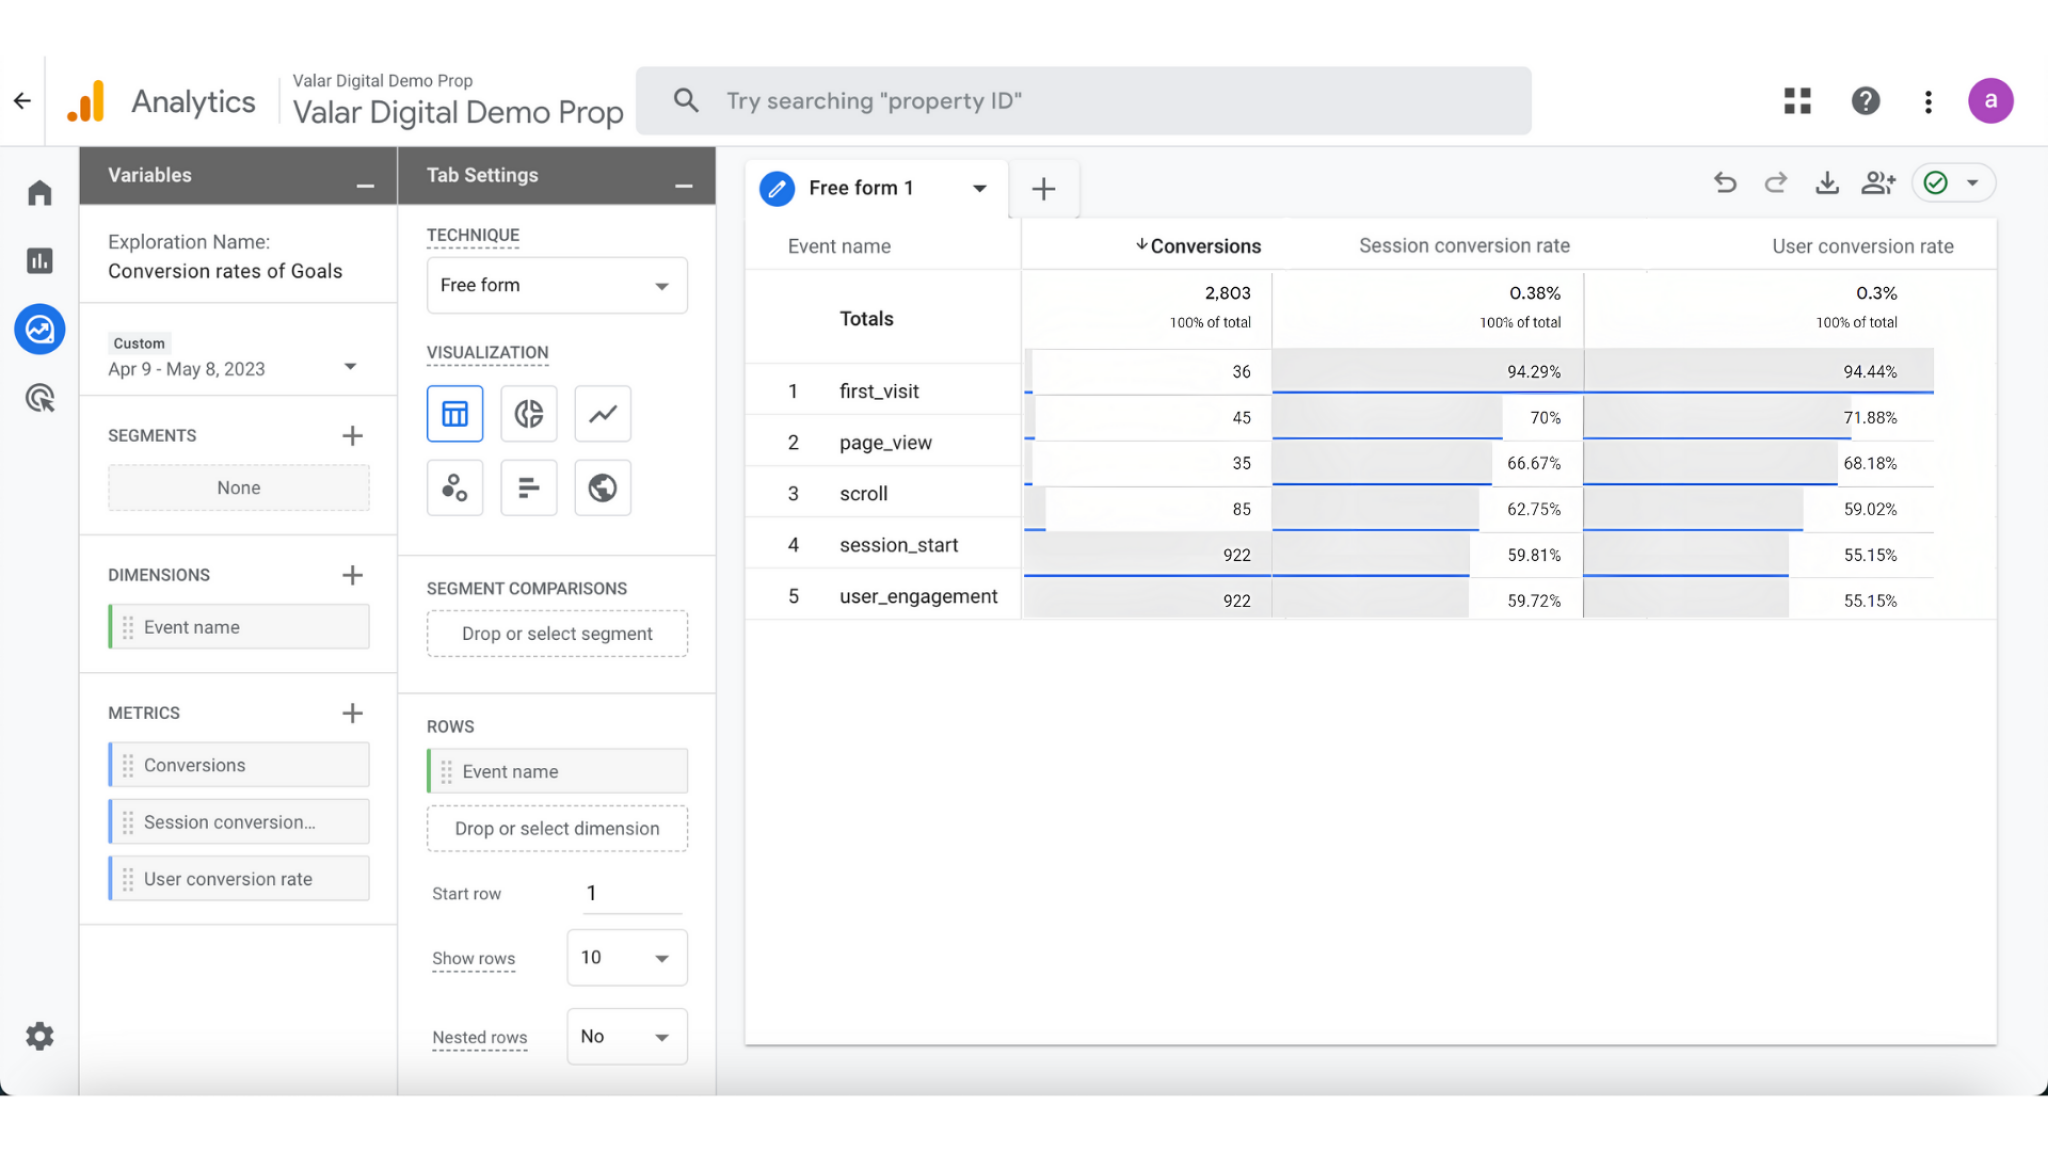 If done correctly, you will see the selected metrics in the form of event names, their conversions, and types (session conversion and user conversion).
The data is populated in the form of graphs in the reports in GA4.